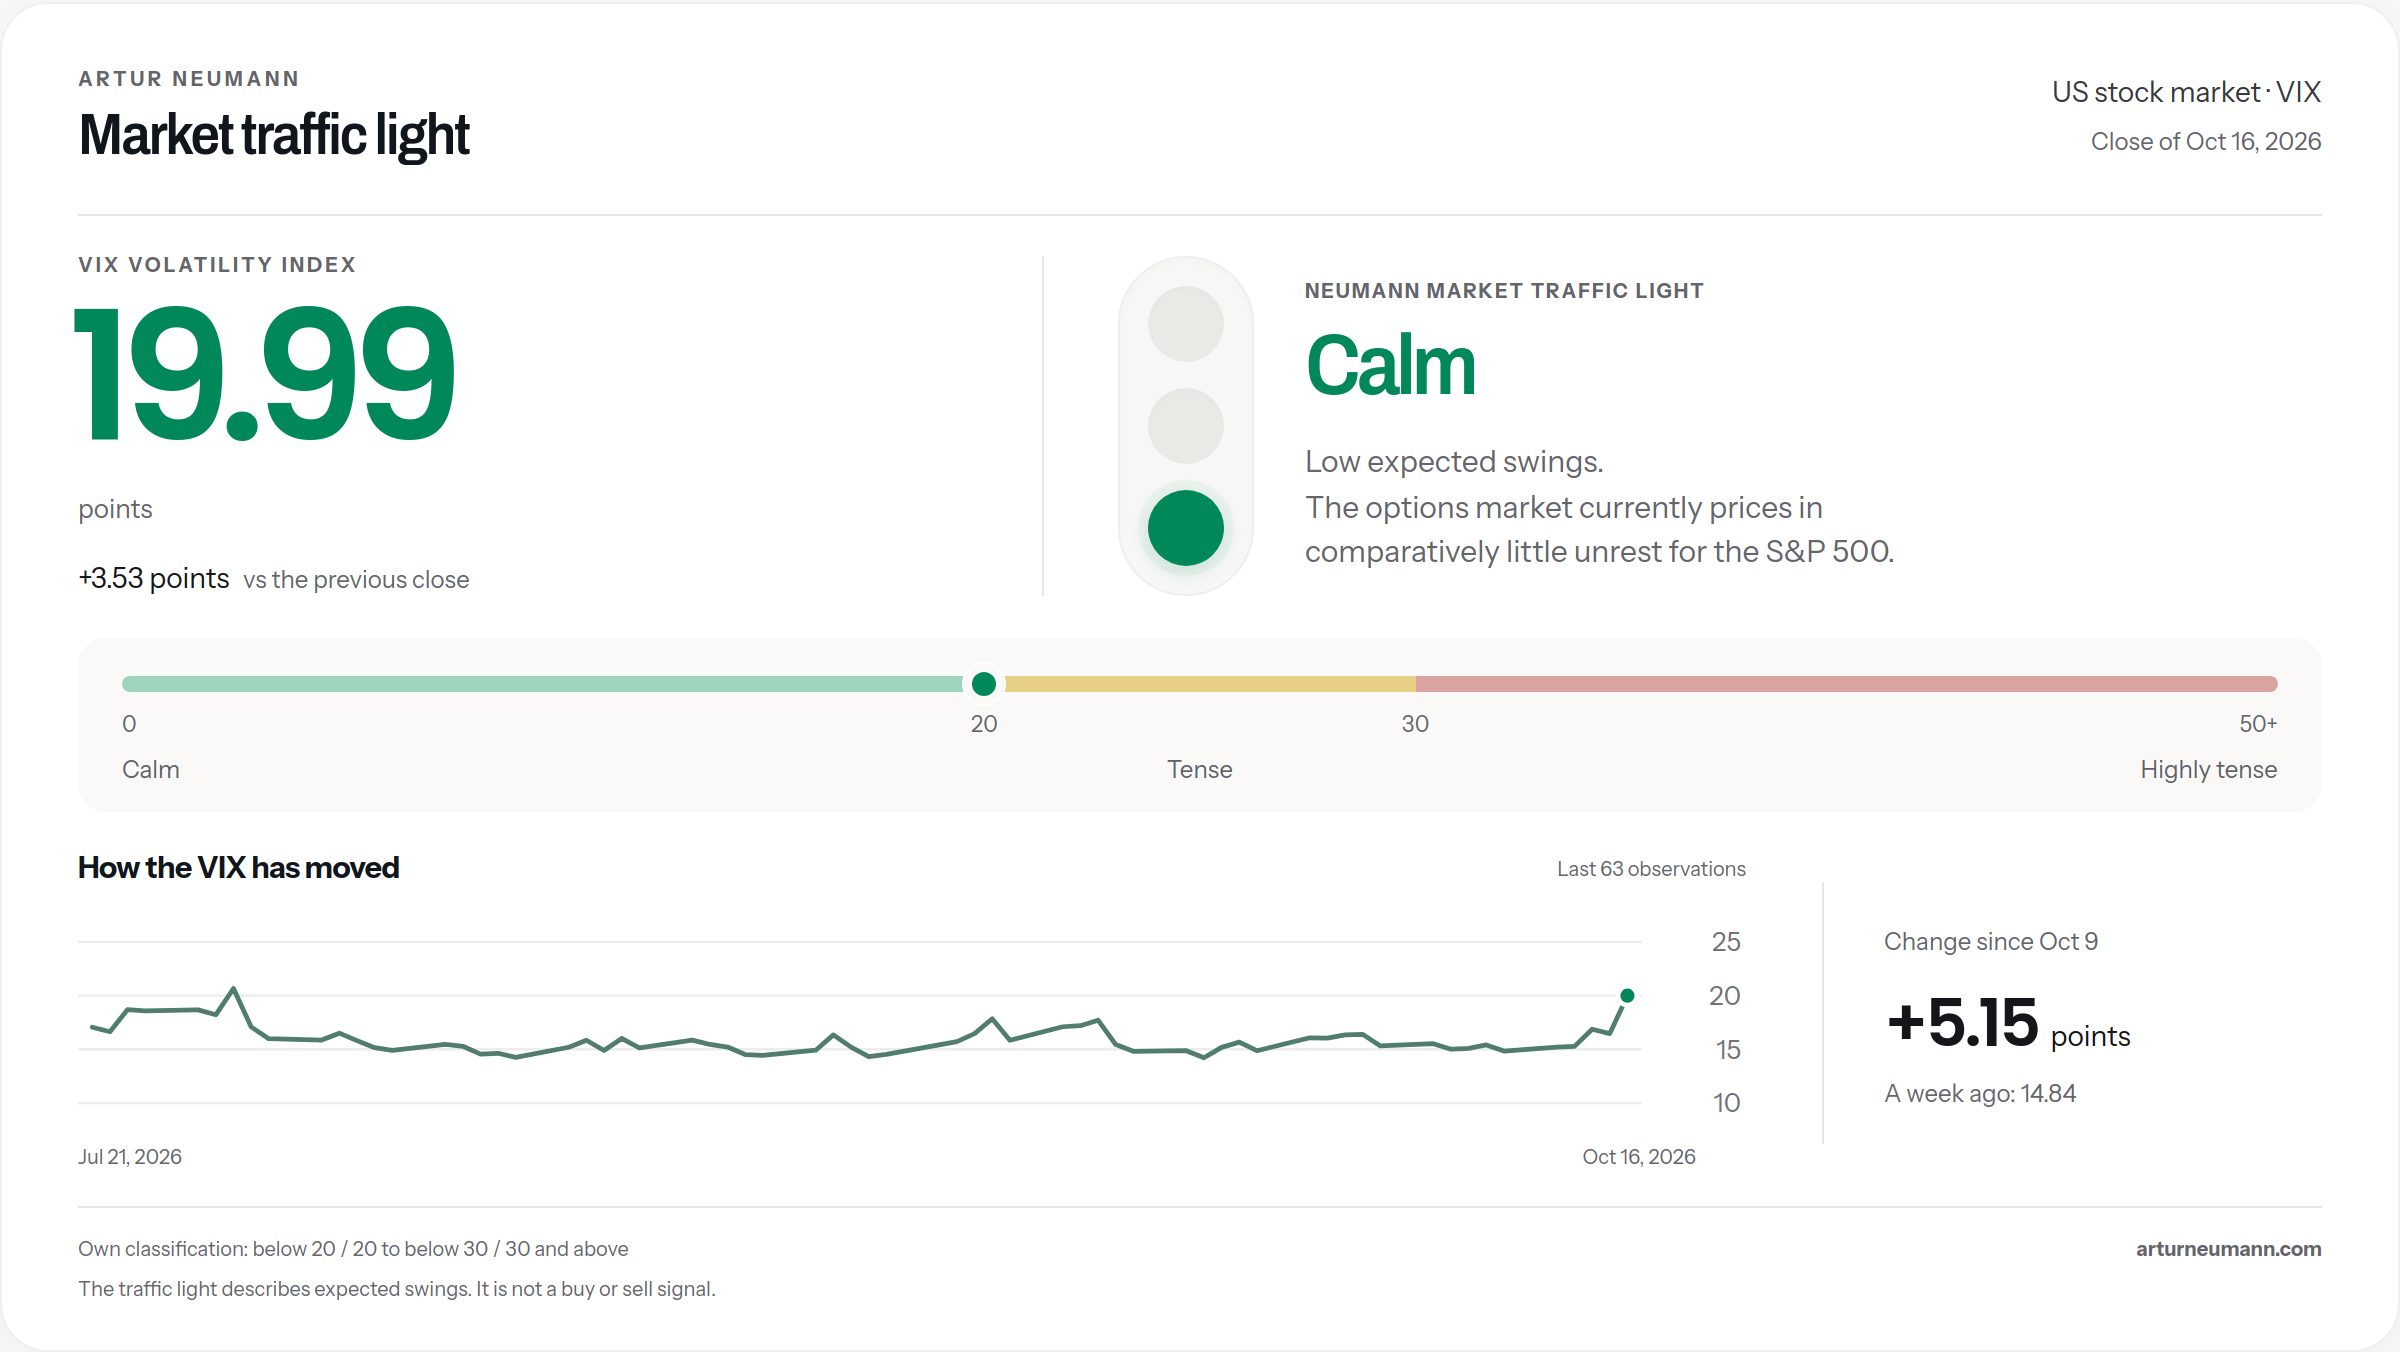
Green means: the market expects little movement.
It does not mean that stocks are cheap right now.
What does the VIX tell you?
The VIX bundles the volatility priced into S&P 500 options for the next 30 days. Volatility means the intensity of price swings. The higher the value, the stronger the price movements that are priced in.
The figure is annualized. A VIX of 20 therefore does not mean that the S&P 500 will lose 20% next month. The index does not show a price direction either.
I use the market traffic light as a starting point for assessing the market environment. Whether a single stock fits your plan is not something the VIX can answer.
Three colors. Clear limits.
The traffic light translates the VIX into three easy-to-read ranges. These are my transparently set guide limits, not official Cboe categories.
Comparatively low expected swings.
Elevated expected swings.
High expected swings.
19.99 points is green. Exactly 20 points is amber. From exactly 30 points the light is red. This keeps the classification traceable every day. Even a very high value stays red.
A limit is not a sudden economic break. The jump from 19.99 to 20.00 barely changes the market environment, even though the color changes. That is why the number and its history always appear right next to it.
Is this a Fear and Greed Index?
The well-known Fear and Greed Index by CNN combines seven market indicators. Volatility is only one component. The Neumann market traffic light uses only the VIX.
A low VIX shows low priced-in swings. You cannot read “greed” from it. That is why the green level is called “calm” here. This distinction helps you read the display correctly.
To CNN's Fear and Greed Index ↗Does the VIX help with an S&P 500 or DAX forecast?
For the S&P 500, the VIX provides information about the expected intensity of swings. A specific future index level cannot be derived from it alone. A high value predicts neither the timing of a low nor the next upward move.
The DAX has its own volatility index: the VDAX, formerly VDAX-NEW. The VIX traffic light on this page refers to the US stock market. It is not a DAX traffic light.
Source: Deutsche Börse on the VDAX ↗If you want to live off your portfolio, your time horizon, your withdrawals and your reserves also count. In the retirement withdrawal calculator you can work through different assumptions. The financial independence calculator helps you put the capital you need into perspective.
Data and method
I retrieve the daily VIX closing values from Financial Modeling Prep (FMP). The latest available value is 19.99 points from Oct 16, 2026. This is a daily closing value, not a live intraday price. The data source is checked for new values every morning and at midday.
Daily updated VIX closing values. No intraday price. The last successful request was on Oct 19, 2026 at 8:15 AM (Berlin time). Weekends and non-trading days do not get an invented new value. That is why the date of the last actual observation sits right next to the index value.
The weekly comparison uses the last available observation on or before the date seven calendar days earlier. Here that is 14.84 points from Oct 9, 2026. The change is +5.15 points. I calculate in index points, not in percent. A rise from 15 to 18, for example, is three points. In percent it would be 20%.
The chart shows the last 63 observations on a calendar time axis. As a result, more time visibly passes between two trading days over a weekend than between two consecutive weekdays. The line connects the available closing values. It adds no prices for days without an observation and contains no forecast for the coming days.
If a request fails, the last verified data stays in place. If a new closing value is overdue, the current color rating is suspended. You then see the historical value with its date and a note. A delayed data request is not a sign that the market has calmed down either.
Data source: Financial Modeling Prep ↗Check the chart values shown
| Date | VIX close |
|---|---|
| Oct 16, 2026 | 19.99 |
| Oct 15, 2026 | 16.46 |
| Oct 14, 2026 | 16.87 |
| Oct 13, 2026 | 15.27 |
| Oct 12, 2026 | 15.21 |
| Oct 9, 2026 | 14.84 |
| Oct 8, 2026 | 15.41 |
| Oct 7, 2026 | 15.08 |
| Oct 6, 2026 | 15.01 |
| Oct 5, 2026 | 15.52 |
| Oct 2, 2026 | 15.31 |
| Oct 1, 2026 | 16.39 |
| Sep 30, 2026 | 16.34 |
| Sep 29, 2026 | 16.04 |
| Sep 28, 2026 | 16.07 |
| Sep 25, 2026 | 14.87 |
| Sep 24, 2026 | 15.67 |
| Sep 23, 2026 | 15.18 |
| Sep 22, 2026 | 14.21 |
| Sep 21, 2026 | 14.87 |
| Sep 18, 2026 | 14.81 |
| Sep 17, 2026 | 15.44 |
| Sep 16, 2026 | 17.71 |
| Sep 15, 2026 | 17.20 |
| Sep 14, 2026 | 17.10 |
| Sep 11, 2026 | 15.84 |
| Sep 10, 2026 | 17.84 |
| Sep 9, 2026 | 16.46 |
| Sep 8, 2026 | 15.72 |
| Sep 4, 2026 | 14.53 |
| Sep 3, 2026 | 14.32 |
| Sep 2, 2026 | 15.20 |
| Sep 1, 2026 | 16.34 |
| Aug 31, 2026 | 14.92 |
| Aug 28, 2026 | 14.43 |
| Aug 27, 2026 | 14.51 |
| Aug 26, 2026 | 15.21 |
| Aug 25, 2026 | 15.45 |
| Aug 24, 2026 | 15.85 |
| Aug 21, 2026 | 15.13 |
| Aug 20, 2026 | 16.01 |
| Aug 19, 2026 | 14.89 |
| Aug 18, 2026 | 15.84 |
| Aug 17, 2026 | 15.19 |
| Aug 14, 2026 | 14.25 |
| Aug 13, 2026 | 14.63 |
| Aug 12, 2026 | 14.55 |
| Aug 11, 2026 | 15.28 |
| Aug 10, 2026 | 15.46 |
| Aug 7, 2026 | 14.90 |
| Aug 6, 2026 | 15.15 |
| Aug 5, 2026 | 15.81 |
| Aug 4, 2026 | 16.50 |
| Aug 3, 2026 | 15.86 |
| Jul 31, 2026 | 15.99 |
| Jul 30, 2026 | 17.09 |
| Jul 29, 2026 | 20.66 |
| Jul 28, 2026 | 18.21 |
| Jul 27, 2026 | 18.67 |
| Jul 24, 2026 | 18.58 |
| Jul 23, 2026 | 18.70 |
| Jul 22, 2026 | 16.64 |
| Jul 21, 2026 | 17.05 |
How I use the weekly comparison
I look at the date first, then at the number and only then at the color. A value just below 20 and a value just above it are close together. The light changes at this limit, even though the expected intensity of swings has barely changed. That is why the exact value and its history stay visible next to the classification.
For a weekly review I compare the same indicator with the same definition. The downloadable image contains the actual data date and the limits used. This makes the classification understandable even without the website. A later screenshot can be matched to the right point in time. A slide from last week still describes the market at that time, even if the website now shows a new value.
For my personal financial planning I also need other numbers. How much money I want to withdraw from my wealth, which reserves I have and how long my investment horizon is cannot be answered by the market traffic light. The classification complements this planning. It replaces neither the valuation of a company nor a check of my own spending.
Related reading: the financial independence calculator, my guide to the 4% rule and the overview Living off your investments. They are about the link between wealth and ongoing spending. The VIX, by contrast, only describes the swings in the S&P 500 priced in on the options market.
Frequently asked questions about the VIX
What is the VIX index?
The VIX is the Cboe volatility index for the S&P 500. It summarizes the intensity of swings expected over the next 30 days, as priced into options. The figure is annualized.
What does it mean when the VIX rises?
A rising VIX means that the options market is pricing in stronger swings. This says nothing certain about the direction of prices. The value alone also does not tell you whether stocks are cheap or expensive.
How is the VIX calculated?
Cboe calculates the VIX from the prices of various call and put options on the S&P 500. Two suitable maturities are converted to a constant expectation horizon of 30 days. Cboe publishes the exact calculation in its index methodology.
Where is the VIX right now?
The latest VIX closing value available here is 19.99 points from Oct 16, 2026. Daily updated VIX closing values. No intraday price. The page shows daily closing values and no live intraday prices.
What is a good level of volatility for stocks?
There is no generally good level of volatility. Low expected swings mean neither freedom from risk nor a cheap valuation. In my market traffic light, values below 20 stand for calm, from 20 to below 30 for tense and from 30 for highly tense. These limits are my classification and not official Cboe signals.
NeumannTerminal
Find the best stocks around the world
NeumannTerminal rates companies from New York to Tokyo by the same rules and shows you why. Try it free for 14 days.
Try NeumannTerminal for freeThis content is for information and education only. It is not personal investment advice and not a recommendation to buy or sell. Prices, figures and expectations can change. Full disclaimer.